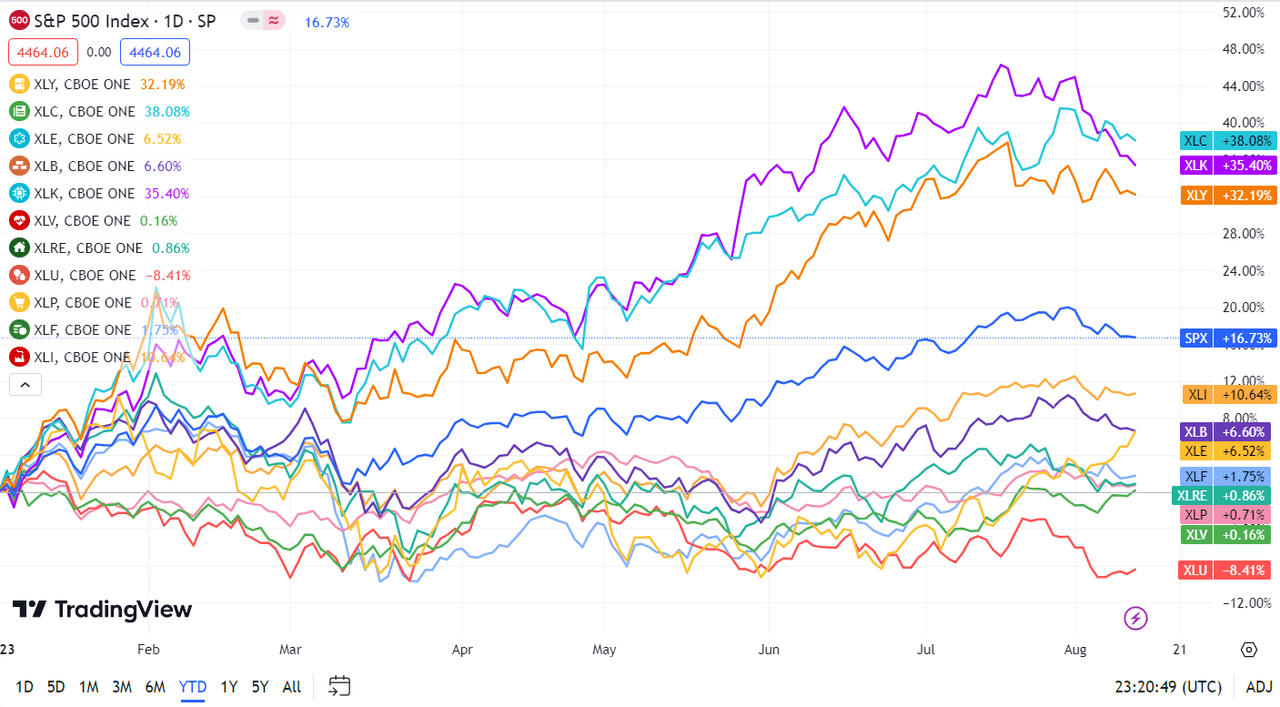
The S&P 500 (SP500) on Friday fell 0.31% for the week to close at 4,464.18 points, posting losses in three out of five sessions. Its accompanying SPDR S&P 500 Trust ETF (NYSEARCA:SPY) retreated 0.26% for the week.
Wall Street’s benchmark gauge posted its second straight negative week, and is now down nearly 3% in August. Markets continue to take a bit of a breather after the massive rally this year that has seen the S&P 500 (SP500) advance more than 16%.
One of the primary reasons for the pullback this week has been an extended decline in technology stocks. Both the Nasdaq Composite (COMP.IND) and the even more tech-focused Nasdaq 100 (NDX) index fell nearly 2% each this week, amid continued concerns over stretched valuations.
Another contributing factor the S&P 500’s (SP500) weekly decline has been mixed signals from inflation reports. The much anticipated consumer inflation report on Thursday showed that the headline and core consumer price index (CPI) was unchanged from June, bolstering bets among market participants that the Federal Reserve would hold off on further rate hikes.
However, hotter-than-anticipated producer inflation data on Friday played spoilsport for risk-on appetite, with both the headline and core producer price index for July rising from the previous month.
Still, the overall picture points to a slowdown in inflation, and has even led to hopes of disinflation. There is a rising consensus among traders that the Federal Reserve will be able to deliver a so-called “soft landing.”
“With this CPI print, we now have three of the five important reports during the intermeeting period for the FOMC that will be key in determining the policy decision in September,” JPMorgan’s Michael Feroli said.
“So far, the picture that emerges from them is clear: continuing moderation in wage and price inflation with a tight labor market. If the next payroll report and the CPI print for August do not change this picture drastically, we don’t see any reason to change our view that the FOMC will hold rates steady in September,” Feroli added.
Treasury yields also garnered significant attention over the past few days, as a sell-off in bonds stretched to a third straight week and put pressure on equities.
Treasury auctions in particular were in the spotlight, with this week’s auctions seen as a test of greater supply on the market after the government boosted its funding targets to add $19B in new cash raised. The 3-year auction on Tuesday and the 10-year auction on Wednesday were seen as strong, but a tough 30-year auction on Thursday tampered some of that positivity.
See how Treasury yields have done across the curve at the Seeking Alpha bond page.
Another driver behind the negative sentiment this week was a Moody’s rating downgrade on Tuesday of several small and mid-sized banks, with the agency also placing six larger lenders on review. The action came after fellow rating agency Fitch last week blindsided markets by downgrading the United States’ top-tier debt rating.
Finally, weak economic data out of China was also a dampener this week. The world’s second-largest economy on Tuesday posted a double digit drop in both export and imports for July. Moreover, on Wednesday, data showed that the Chinese economy had slipped into deflation for the first time in over two years.
Commodities took a bit a hit from the China story, however oil prices showed resilience. In fact, WTI and Brent crude oil futures each notched their seventh straight weekly gain in their longest winning streaks since February last year. Reduced supply from Saudi Arabia along with fairly high global demand levels helped offset any concerns over a hit to demand from China, which is one of the world’s biggest importers of oil.
Turning to the weekly performance of the S&P 500 (SP500) sectors, seven ended in the green, with Energy leading the winners on the back of strength in oil prices. Technology ended as the top loser. See below a breakdown of the performance of the sectors as well as their accompanying SPDR Select Sector ETFs from August 4 close to August 11 close:
#1: Energy +3.54%, and the Energy Select Sector SPDR ETF (XLE) +3.43%.
#2: Health Care +2.46%, and the Health Care Select Sector SPDR ETF (XLV) +2.47%.
#3: Real Estate +1.03%, and the Real Estate Select Sector SPDR ETF (XLRE) +0.86%.
#4: Utilities +0.84%, and the Utilities Select Sector SPDR ETF (XLU) +0.91%.
#5: Industrials +0.53%, and the Industrial Select Sector SPDR ETF (XLI) +0.60%.
#6: Communication Services +0.33%, and the Communication Services Select Sector SPDR Fund (XLC) +0.04%.
#7: Consumer Staples +0.30%, and the Consumer Staples Select Sector SPDR ETF (XLP) +0.20%.
#8: Financials -0.02%, and the Financial Select Sector SPDR ETF (XLF) +0.03%.
#9: Consumer Discretionary -0.99%, and the Consumer Discretionary Select Sector SPDR ETF (XLY) -1.07%.
#10: Materials -1.00%, and the Materials Select Sector SPDR ETF (XLB) -1.02%.
#11: Information Technology -2.87%, and the Technology Select Sector SPDR ETF (XLK) -2.49%.
Below is a chart of the 11 sectors’ YTD performance and how they fared against the S&P 500 (SP500). For investors looking into the future of what’s happening, take a look at the Seeking Alpha Catalyst Watch to see next week’s breakdown of actionable events that stand out.


